
Image rendering
Two Lightweight Graphing Techniques for MVC
Your users will enjoy your apps more, and be more productive, when you use charts and graphs, where possible. Because they can mentally process a graphic faster than the corresponding numbers. When you make it easier for your users, you should get some positive feedback from grateful users!
Two Lightweight Technologies
There are lots of ways to create simple charts in HTML, here’s a couple that I recently found useful:
- SVG (Scalable Vector Graphics), a fairly new feature in HTML
- Dynamically-rendered images which you build on-the-fly using the .NET Drawing library
These two are great for small charts whose purpose is self evident. They are both good for inserting inside a table row, which I needed. Sadly, our PDF conversion technology won’t handle SVGs, which is why I investigated the second technique.
Other Chart Tools – for Bigger, Complicated Charts
Both of the two approaches above give you full customization, if you can do a little arithmetic. There are other methods available for fancier charts, including:
These are fine if you need a big chart with legends, axes, tick lines, titles, etc. They also won’t fit into a table cell, are complicated to learn, harder to customize, and, in the case of MS charts, badly documented. I used these technologies elsewhere, but for now, I do not want all the features they offer.
Explanation
Note that both samples above are data driven, created in response to the data being displayed.
At work, I use this to display inspection data. The data displayed summarizes pass/fall/monitor counts for inspection details. Any given inspection may, for example, have 10 failed inspection details (red), 5 details needing monitoring (yellow) and 40 passed (green) detail items. Effectively, I am graphing the header for the inspection, showing the severity of its details. Also at work, I place the chart inside a table, which is one reason I don’t want a full-bore chart control.
The nice thing about this is I always know I will need between 0 and 3 colored rectangles.
Each chart is a set of 3 rectangles: one rectangle fore each color. With both technologies, drawing a rectangle is simple matter of calculating the height and width, specifying a color and a position to draw it at. I think you know enough for me to jump into some code:
Here’s the Code from my MVC View File (.cshmlt)
@model ProgBar.Models.Inspection

@Html.Raw(Model.ColorGraph)

<img src="@Url.Action("GetHorizontalBarchartImg",
		new { red = Model.RedCount,
			  yellow = Model.YellowCount,
			  green = Model.GreenCount })" />
The code above is from my View file, which, if you don’t know MVC, is the last layer of code before the web server sends the html page to the user. Obviously, my model and controller are doing the work here, but I wanted to show you the simple part first! In case you aren’t familiar with MVC, the model statement at the top makes it possible to reference my model class (“Inspection”) in the markup, for example, ColorGraph is a property of my model, and ‘GetHorizontalZBarchartmg” is a method on that same class.
Here’s How it Looks When Rendered into HTML
<!-- The SVG rendered into HTML -->
<svg Height='40' Width='100'>
    <rect x='0' y='0' width='18.1818181818182' height='20' fill='red'>
      <title>10</title>
    </rect>
  <rect x='18.1818' y='0' width='9.09090909090909' height='20' fill='yellow'>
    <title>5</title>
  </rect>
  <rect x='27.2727' y='0' width='72.7272' height='20' fill='green'>
    <title>40</title>
  </rect>
  <text x='0' y='31' fill='black' font-size='8'>R:10/Y:5/G:40</text>
</svg>

<!-- The second technique, an image rendered into HTML -->
<img src="/Inspection/GetHorizontalBarchartImg?red=10&yellow=5&green=40" />
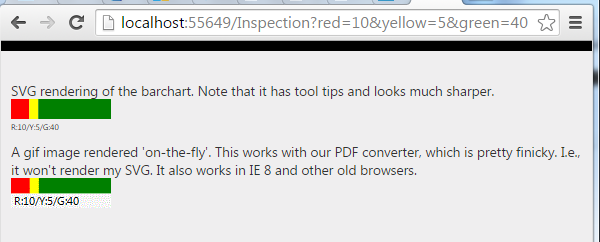
As you can see, the SVG item has all the details, which gives the benefit of allowing you to manipulate it with javascript (for example, you could make something happen when user clicks a colored rectangle). In contrast, the image is a just like any other, except for the fact that I render it on demand. It is completely static by the time it arrives at the users’ browser.
Now the Code to Build my SVG
  public class Inspection {
    private int DEFAULT_HEIGHT = 30;
    private int DEFAULT_WIDTH = 100;

    private string _ColorGraph = "";
    public string ColorGraph {
      get {
        if (string.IsNullOrWhiteSpace(_ColorGraph))
          _ColorGraph = BuildColorGraph();
        return _ColorGraph;
      }
    }

    private string BuildColorGraph() {
      string boxPattern = "<rect x='{0}'  y='{1}' width='{2}' height='{3}' fill='{4}'><title>{5}</title></rect>";
      string redRect = "", greenRect = "", yellowRect = "";
      int tot = RedCount + GreenCount + YellowCount;
      double barHeight = 20;//0.667 * Height;

      if (RedCount > 0) {
        redRect = string.Format(boxPattern, 0, 0, Width * ((double)RedCount / tot), barHeight, "red", RedCount);
      }

      double xPos = Width * ((double)RedCount / tot);
      if (YellowCount > 0) {
        yellowRect = string.Format(boxPattern, xPos, 0, Width * ((double)YellowCount / tot), barHeight, "yellow", YellowCount);
      }

      xPos += Width * ((double)YellowCount / tot);
      if (GreenCount > 0) {
        greenRect = string.Format(boxPattern, xPos, 0, Width * ((double)GreenCount / tot), barHeight, "green", GreenCount);
      }

      string textPattern = "<text x='{0}' y='{1}' fill='black' font-size='8'>R:{2}/Y:{3}/G:{4}</text>";
      string theText = string.Format(textPattern, 0, 31, RedCount, YellowCount, GreenCount);
      string result = "<svg Height='" + Height.ToString() + "' Width='" + Width.ToString() + "'>"
            + redRect
            + yellowRect
            + greenRect
            + theText
            + "</svg>";
      return result;
    }

    public string InspectionNumber { get; set; }
    public int RedCount { get; set; }
    public int GreenCount { get; set; }
    public int YellowCount { get; set; }

    private int _Height;
    public int Height {
      get {
        if (_Height == default(int))
          _Height = DEFAULT_HEIGHT;
        return _Height;
      }
      set { _Height = value; }
    }
    private int _Width;
    public int Width {
      get {
        if (_Width == default(int))
          _Width = DEFAULT_WIDTH;
        return _Width;
      }
      set { _Width = value; }
    }
}
As you can see, I just build a string that looks like the rendered HTML. I build each rectangle separately, as a string, then concatenate three all together. The only “hard” part is calculating the rectangle widths, which you should be able to do if you can perform elementary algebra.
Hair-Splitting?
Some purists would say the model should not be responsible for creating any kind of formatting, and they’d have a point. My Inspection class should not return html; it should be agnostic about the display technique used. And they’d be right. However, it is pretty easy to move the code into the controller; I have not done so because I was not able to make this fine code work with our PDF generator.
If you want to move that code into the controller, it would be with a technique similar to how I build my chart image, in the next section.
Here’s the Code to Dynamically Render an Image
public class InspectionController : Controller
{
    public ActionResult GetHorizontalBarchartImg(int red, int yellow, int green,
        int canvasHeight = 30, int canvaseWidth = 100) {

        Bitmap bmp = new Bitmap(canvaseWidth, canvasHeight);
        Graphics g = Graphics.FromImage(bmp);
        g.SmoothingMode = System.Drawing.Drawing2D.SmoothingMode.HighQuality;
        float colorSum = red + yellow + green;
        float redWidth = (float)(red / colorSum * 100);
        float yellowWidth = (float) (yellow / colorSum * 100);
        float greenWidth = (float) (green / colorSum * 100);
        if (red > 0) {
            if (redWidth < 1)
                redWidth = 1;
            g.FillRectangle(Brushes.Red, 0.0F, 0.0F, redWidth, 15);
        }

        if (yellow > 0) {
            if (yellowWidth < 1)
                yellowWidth = 1;
            g.FillRectangle(Brushes.Yellow, redWidth, 0, yellowWidth, 15);
        }

        if (green > 0) {
            if (greenWidth < 1)
                greenWidth = 1;
            g.FillRectangle(Brushes.Green, redWidth + yellowWidth, 0, greenWidth, 15);
        }

        g.FillRectangle(Brushes.WhiteSmoke, 0, 15, 100, 15);
        string caption = string.Format("R:{0}/Y:{1}/G:{2}", red, yellow, green);
        g.DrawString(caption, new Font("Segoe UI", 8F), Brushes.Black, 1, 16);

        using (MemoryStream ms = new MemoryStream()){
            bmp.Save(ms, System.Drawing.Imaging.ImageFormat.Gif);
            return File(ms.GetBuffer(), "image/gif");
        }
    }

    public ActionResult Index(int red, int yellow, int green) {
        Models.Inspection insp = new Models.Inspection { GreenCount = green,
                          RedCount = red,
                          YellowCount = yellow,
                          Height = 40,
                          Width = 100
                        };
        return View("index", insp);
    }
}
Note: you will need to add a reference to your project, to System.Drawing.
Also note: depending on your security model, you may need to decorate the ‘GetHorizontalBarchartImg’ method with an ‘[AllowAnonymous]’ tag.
The big picture:
- First I get a drawing context to an in-memory Bitmap object
Graphics g = Graphics.FromImage(bmp);
- Use the drawing method ‘fillRectangle’ to build 3 colored rectangles, for example,
g.FillRectangle(Brushes.Red, 0.0F, 0.0F, redWidth, 15);
- Add other features to the bitmap, such as text
g.DrawString(caption, new Font("Segoe UI", 8F), Brushes.Black, 1, 16); - Save your bitmap to a memory stream (any stream type will work, memory stream is best for use)
- Convert the memory stream to a file and return it to your caller, namely, your page controller.
        using (MemoryStream ms = new MemoryStream()){
            bmp.Save(ms, System.Drawing.Imaging.ImageFormat.Gif);
            return File(ms.GetBuffer(), "image/gif");
        }
Summary
There are lots of ways to build charts, and users typically love them. SVG is great for small charts, but for my purposes, wasn’t easy to convert to PDF (there are other ways and I sure it would work fine in your environment). You can also build an image in memory, and return it to your controller as a dynamically-built file object.
Both techniques involve drawing rectangles with arithmetic and simple algebra. You can provide any color you like and the text is optional.
Download the Code!
You can get the code and play with it, or adapt it to your needs. Link to download
