
data visualization
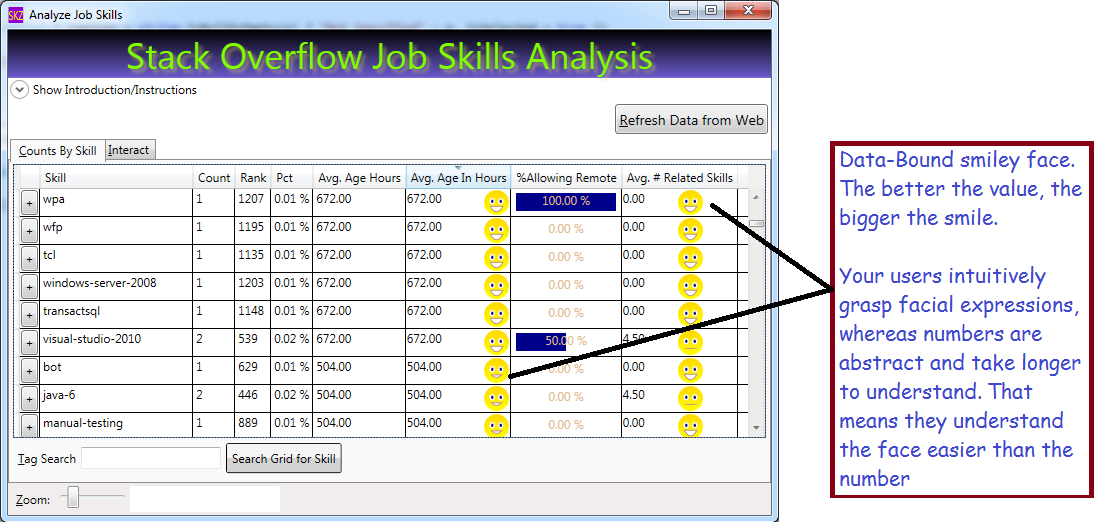
Use a DataBound Smiley Face for Super-Easy Data Comprehension
Humans can understand a smile in a heartbeat, but they need to think to parse a number. You can deal with that by displaying your data with smiley faces. Result: you will put a smile on your users’ faces, making their data easy to understand. By doing so, you’ll reduce your app’s overall costs, because training costs will be lower. Also, your users will get their work done faster when they can understand their data rapidly. For some apps, that speed can make the difference between profit or loss, such as apps used in fast-paced financial markets. If your company is work a meritocracy, you will be rewarded when your reduce costs for your company!

What We Will Use to Build Our Data-Bound Smiley Face
- A WPF UserControl
- WPF Geometry Drawing, including
- EllipseGeometry (to draw the eyes and the face)
- Geometry Path Markup Strings – to draw the smile
- DependencyProperty – we add one to our UserControl to expose our new property ‘SmilePct’
- DataBinding – I’ll share a real pain-saver that will help you bind UserControls in DataGrids
- DataGridTemplateColumn – to host our SmileyFace in our grid
Get Started: Build Your UserControl
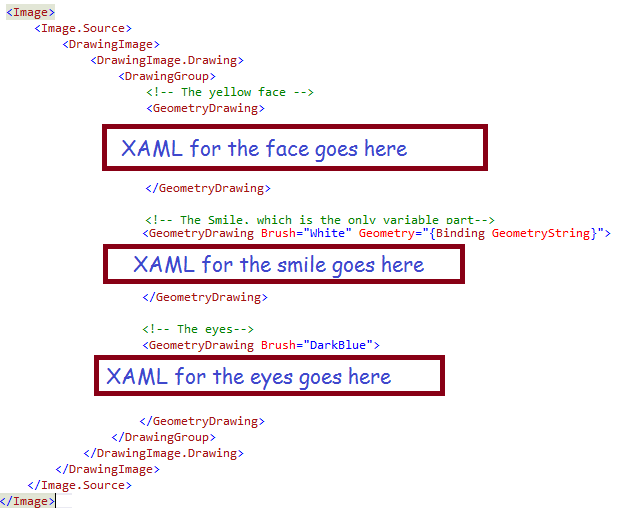
Hopefully you already know how to add a UserControl to your project (right-click your project in Solution Explorer, choose, ‘Add’, then pick ‘UserControl’). We will build a user control that has an Image for its XAML (no grid or StackPanel needed). We will draw 3 different parts in our image:
- The Face
- The Smile (data-bound)
- The Eyes
XAML for the Face
For the face, we will use a simple circle (actually an ellipse, but you probably know that a circle is merely a special case of an ellipse) with a gradient background.
<!-- The yellow face -->
<GeometryDrawing>
    <GeometryDrawing.Geometry>
        <!-- Draw the circle, which will represent the face -->
        <EllipseGeometry RadiusX="12.5" RadiusY="12.5" Center="6.25, 6.25"  />
    </GeometryDrawing.Geometry>
    <GeometryDrawing.Brush>
        <LinearGradientBrush EndPoint="0.5,1" StartPoint="0.5,0">
            <GradientStop Color="Gold" Offset="0"/>
            <GradientStop Color="Yellow" Offset="1"/>
        </LinearGradientBrush>
    </GeometryDrawing.Brush>
</GeometryDrawing>
To specify an ellipse, we describe the 1) size and shape using the RadiusX and RadiusY, plus 2) the position using the Center, which is described in Cartesian Coordinates (with the origin in the upper left corner of our Image). So, our face will be 25 pixels high (i.e. double the radius) and 25 pixels wide (double the RadiusX). Since RadiusX and RadiusY are equal, we will have a circle.
XAML for the Smiley
For the smile, we will use a string representation of the drawing to draw an ArcSegment. If you remember your geometry, or if you like to eat pies or pizza, you should already know that the ArcSegment is just the line represented by pizza crust. Basically a chunk of curve ripped out of a circle or, in the general case, an ellipse. We will build the geometry string in code; a sample geometry string looks like this: “M 0,10 A 10,25 0 0 0 12.5,10 Z”. I will explain how they work shortly; first, let’s look at the smiley XAML:
 <!-- The Smile, which is the only variable part-->
≶!-- The data binding will get the geometry from our code behind -->
 <GeometryDrawing Brush="White" Geometry="{Binding GeometryString}">
     <GeometryDrawing.Pen>
         <Pen Brush="RosyBrown" Thickness="1" />
     </GeometryDrawing.Pen>
 </GeometryDrawing>
It looks like not much is happening; that is because all the work is done via the Geometry property, which is bound to our code-behind. You can see the white brush, which is used for filling-in the teeth, and the pen (RosyBrown) which draws the lips. The shape of the lips is controlled via data binding, using a class property which I set in code. I will explain the Geometry string after explaining the XAML for the eyes. One further point: until now, I have not mentioned the data source I am binding to; in this case, I am binding to my own code-behind. I omitted that code until now (for clarity). To use your own code-behind for data binding, simply use the markup shown here to declare your UserControl:
XAML for the Eyes
For the eyes, we will draw two ellipses. They are similar to the face; their RadiusY is slightly larger than their RadiusX, to make them taller than wide, and they user different colors than the face.
<!-- The eyes-->
<GeometryDrawing Brush="DarkBlue">
    <GeometryDrawing.Pen>
        <Pen Brush="White" Thickness="1.5" />
    </GeometryDrawing.Pen>
    <GeometryDrawing.Geometry>
        <GeometryGroup>
            <!-- Draw 2 ellipses, each slightly taller than wide, for the eyes -->
            <!-- Left eye-->
            <EllipseGeometry RadiusX="2" RadiusY="2.5" Center="2,5" />
            <!-- Right eye-->
            <EllipseGeometry RadiusX="2" RadiusY="2.5" Center="10.5, 5" />
        </GeometryGroup>
    </GeometryDrawing.Geometry>
</GeometryDrawing>
Now, for the UserControl Code-Behind
The code-behind has a simple structure: just two properties:
- The GeometryString property, which tells WPF how to draw the smile, and
- The SmilePct property, which allows the outside world to control the size of our grin. 100% → big smile, while 0% → straight face
You might have noticed from my screen shots that my face never frowns, it just varies from a straight line to a big smile. I did that because, for one reason, it is a little easier, and also because I don’t want any frowns in my apps!
DependencyProperties
OK, I only have two properties, but you should make them be special DependencyProperty instances, because that is what works best with UserControls. DependencyProperties are similar to INotifyPropertyChanged properties, but designed for special situations like UserControls, etc. Here’s a quick tip: Visual Studio will help you stub-out a DependencyProperty if you type the shortcut ‘propdp‘ and hit the tab key. For details, take a look at my Visual Studio Quick Tip on the Snippet Manager. Here’s what my two properties look like:
private static string NO_SMILE = "M 5,12.5 A 10,0 0 0 0 7.5, 12.5 Z";

public string GeometryString {
    get { return (string)GetValue(GeometryStringProperty); }
    set { SetValue(GeometryStringProperty, value); }
}

//Windows stores the property value (for GeometrySttring) on your behalf, so you don't
//declare any variable to hold the value
public static readonly DependencyProperty GeometryStringProperty =
    DependencyProperty.Register("GeometryString", typeof(string),
	typeof(DataBoundSmiley), new PropertyMetadata(NO_SMILE));


public double SmilePct {
    get { return (double)GetValue(SmilePctProperty); }
    set { SetValue(SmilePctProperty, value); }
}

//Note the callback referenced below, 'OnSmileyPctChanged'
public static readonly DependencyProperty SmilePctProperty =
    DependencyProperty.Register("SmilePct", typeof(double),
	typeof(DataBoundSmiley), new PropertyMetadata(0.0, OnSmileyPctChanged));
Where’s the Logic?
I deliberately skipped the complicated part, so that I could emphasize the fact that I only have two properties in my code-behind. All the work happens when the SmilePct is set to a new value, which causes the callback method ‘OnSmileyPctChanged‘ to be invoked. That is where we assign the value for our GeometryString. The geometry string will vary between these two extremes, which I will explain shortly:
- Big Smile = “M 0,10 A 10,25 0 0 0 12.5,10 Z”;
- No Smile = “M 5,12.5 A 10,0 0 0 0 7.5, 12.5 Z”;
Geometry Path String Explanation:
- “M 0,10” means start the drawing at the coordinates (0,10). “M 5,12” means start the drawing at coordinates (5,12.5)
- “A 10,25 0 0 0 12.5,10 Z” defines an ArcSegment, where
- “A” means start the arc
- “10,25” means RadiusX =10,RadiusY =25
- “0 0 0” means: (first zero) rotate 0 degrees; (second zero) IsLargeArc = false; (third zero) means Clockwise = false
- “12.5,10″ means finish the arc at coordinates (12.5,10)
- “Z” means close the arc, i.e. draw a line from the end point to the start point, which, for us, represents the top lip
Besides ArcSegments, you can draw LineSegments, BezierSegments and QuadraticBezierSegments. You can read more about them here: https://msdn.microsoft.com/en-us/library/ms752293(v=vs.110).aspx. So, basically, my method ‘OnSmileyPctChanged’ serves to build a string like either 1) the big smile string listed above, 2) the no smile string, or 3) some arc segment intermediate between them. I’ll list the code here, but leave it to you to figure-out the algebraic computations involved. Remember, my callback is invoked when the SmilePct property is set.
public static void OnSmileyPctChanged(object sender, DependencyPropertyChangedEventArgs e) {
    double theVal = (double)e.NewValue;
    //protect against bad data:
    if (theVal < 0)
        theVal = 0.0;
    else if (theVal > 1.0)
        theVal = 1.0;

    double xInit = 5 - (5.0 * theVal);
    double yInit = 12.5 - (2.5 * theVal);
    double pctHappy = (25 * theVal);
    double xTerm = 7.5 + (5.0 * theVal);
    double yTerm = 12.5 - (2.5 * theVal);
    DataBoundSmiley theInstance = (DataBoundSmiley)sender;
    theInstance.GeometryString = string.Format("M {0}, {1} A 10,{2} 0 0 0 {3},{4} Z",
                                               xInit, yInit, pctHappy, xTerm, yTerm);
}
Final notes on the code-behind: the input parameter ‘sender‘ represents our UserControl; ‘e‘ is the event args, containing the NewValue (for SmilePct) and other info. Since the method is static (required by WPF), we need to set the value of the GeometryString on the specific instance of the control which is identified by the input parameter ‘sender’.
Code-Behind Summary
OK, at this point, I’ve shown you the code to create the UserControl, which is basically just a drawing with three ‘sub’ GeometryDrawing elements. We use ellipses for the face and eyes, and the smile is an ArcSegment which I bind to a DependencyProperty in my code-behind. The property ‘GeometryString’ is set in my method ‘OnSmileyPctChanged’; in that method, I use some algebra to define the ArcSegment corresponding to a big smile for high value of SmileyPct. All told, the control consists of
- 54 lines of XAML, and
- 60 lines of code
Using the Data-Bound Smiley in a DataGrid
I won’t talk about DataGrid basics here, suffice it to say that I will add a template column to my DataGrid to host my smiley UserControl. Actually, I want the single column to display a smiley face and a numeric value, which is easy if I embed a grid inside my template. Here’s the XAML, which I have simplified to only display the grid and the template column:
<DataGrid AutoGenerateColumns="False" Name="grdCountsByTag" IsReadOnly="True"  >
    <DataGrid.Columns>
        <!-- Other columns omitted for brevity. Define a template column here: -->
	<DataGridTemplateColumn Header="Avg. Age In Hours" CanUserSort="True" SortMemberPath="AvgAgeInHours">
            <DataGridTemplateColumn.CellTemplate>
                <DataTemplate>
                    <Grid>
                        <!-- Textblock holds the number -->
                        <TextBlock Text="{Binding AvgAgeInHours, StringFormat=N2}" />
                        <!--Now the smilley; note the data binding, which was tricky -->
                        <local:DataBoundSmiley Grid.Column="1"
                                               SmilePct="{Binding DataContext.AvgJobAgePct,
                                                          RelativeSource={RelativeSource AncestorType=DataGridRow}}" />
                        <Grid.ColumnDefinitions>
                            <ColumnDefinition />
                            <ColumnDefinition Width="auto" />
                        </Grid.ColumnDefinitions>
                    </Grid>
                </DataTemplate>
            </DataGridTemplateColumn.CellTemplate>
        </DataGridTemplateColumn>
    </DataGrid.Columns>
</DataGrid>
Notes:
The prefix ‘local’ is an XMLNS definition which we place at the top of our form, like this:
The namespace declaration allows us to reference classes from our own project in the XAML. The TextBlock is bound to a separate (but related) column: AvgAgeInHours. The Smiley control is bound to a field named ‘AvgJobAgePct’. The first, AvgAgeInHours, varies between 0 and 672 (usually), while AvgJobAgePct varies between 0 and 1; the two are inversely proportional. The data binding expression also bears notice, as I spent almost as much time on this as the rest of the code. It was a major source of frustration! Some key points:
- A normal control (such as my TextBlock) binds directly to the same data source as the grid
- Maddeningly, custom controls do not, their data source is, AFAIK, themselves
- Which is why I needed to use the RelativeSource syntax to find the data source for the Grid Row hosting our control, i.e.
RelativeSource={RelativeSource AncestorType=DataGridRow} - The DataContex syntax (e.g. ‘DataContext.AvgJobAgePct’) is used to avoid binding to properties of the Grid Row, such as width/height, and instead goes for the data source used to display the row
Summary
The smiley control quickly conveys meaning to your users, making their lives easier. A UserControl is the best way to build a re-usable container to display your data – without it, you would not be able to display smileys for two separate columns. The UserControl I built uses an Image containing a GeometryGroup which, in turn, holds three GeometryDrawings (face, eyes and smile). The Smile is defined in my control’s code-behind as a DependencyProperty; I build it using the syntax for the WPF Path Markup. Specifically, I use it to draw an ArcSegment, whose curve and endpoints vary according to the SmilePct. If you want your users to easily comprehend your data, I recommend you use my data-bound smiley, because users recognize faces with little mental effort. To get download code, you can go to my open source project on CodePlex: http://visualizejobskills.codeplex.com/
Make Your Data Graphical in WPF
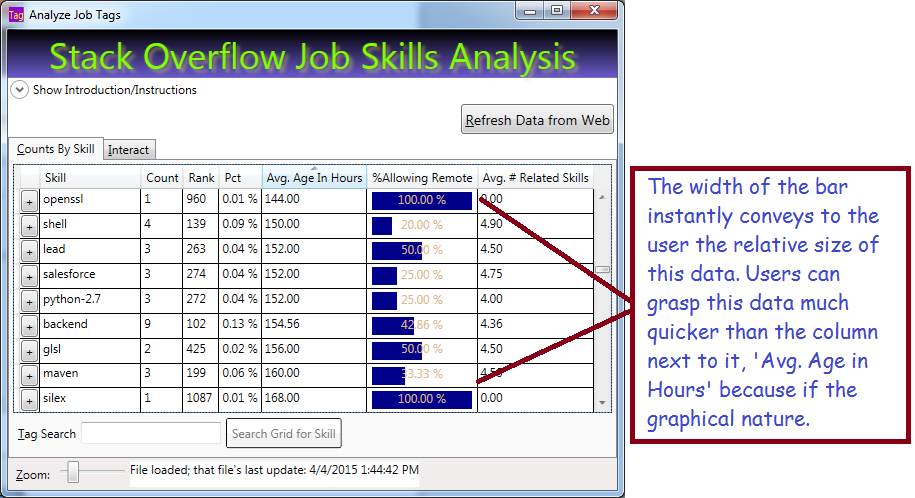
Data Visualization and User Experience (UX) is very important in making your apps easy to use. If your apps are easy to use, they will be cheaper for your employer, because users will require less training and grasp the data faster. Hopefully, that will reflect positively on you too!. In this blog post, I will show a simple way to display a bar graph inside your grid to represent data.
The Basic Ingredients
To make this work, we will use:
- Data Converter which allows the UI to convert a percentage value to a bar-graph width
- DataTemplateColumn in the grid to display the bar graph
- Rectangle, with variable width and colored background, to represent the value. Bind your rectangle width to the value
- Textblock with transparent background to display the numeric value
The Converter
If you work with WPF, you already know that converters are used to bridge the gap between your data and the UI. Your converter will implement the interface IValueConverter; that will allow you to add it as a resource to your page. Basically, you write a bit of code in a simple class, add it as a resource to your page, then reference it in your data binding. Here is the code to write the Converter:
using System;
using System.Windows;
using System.Windows.Data;

namespace CountJobTags {
    public class Pct2WidthConverter : IValueConverter {
        public object Convert(object value,
                             Type targetType,
                             object parameter,
                             System.Globalization.CultureInfo culture) {
            //'value' is PctAllowingRemote'
            if (value is double) {
            //Result will be int between 0 and 100: the width of the rectangle
                return (int)(100 * (double)value);
            }
            return 0;
        }

        //ConvertBack is used for read-write, this is readonly
        public object ConvertBack(object value,
                                  Type targetType,
                                  object parameter,
                                  System.Globalization.CultureInfo culture) {
            return DependencyProperty.UnsetValue;
        }
    }
}
Your UI calls your converter for the PctAllowingRemote value in every grid row. The parameter ‘value’ holds what we bind to in the grid. Don’t worry, this will make more sense shortly.
Reference the Converter in your XAML
Once we have the code class to convert between our value (PctAllowingRemote) and the rectangle width, we need to reference the converter class in our XAML. To do so, we will need:
- Resource
- XMLNS reference to the class namesapce in our XAML, basically a shortcut prefix
Here’s the XAML from the top of my window where I set-up the XMLNS reference (XMLNS == XML NameSpace):
<Window x:Class="CountJobTags.MainWindow"
        xmlns="http://schemas.microsoft.com/winfx/2006/xaml/presentation"
        xmlns:x="http://schemas.microsoft.com/winfx/2006/xaml"
        xmlns:local="clr-namespace:CountJobTags"
        Title="Analyze Job Tags" Height="750" Width="705"
        MinHeight="300" MinWidth="400"
        FocusManager.FocusedElement="{Binding ElementName=btnFetch}"
        DataContext="{Binding RelativeSource={RelativeSource Self}}"
        WindowStartupLocation="CenterScreen" >
Basically, the highlighted code allows me to reference my own code inside the markup, using the prefix ‘local’ in front of any class names I need. ‘CountJobTags’ is the namespace that my class lives in. Relax: the Intellisense will help you write this code if you just type ‘xmlns:’ and pause.
Now, let’s use the prefix ‘Local’ to reference my converter as a resource. We enter the XAML below somewhere on our page. Of course, there are other ways, this is the most straighforward. We’re almost there!
<Window.Resources>
    <!-- Converts percentage to an int between 0 and 100, suitable for binding to a rectangle width to represent a bar graph -->
    <local:Pct2WidthConverter x:Key="widthConverter" />
</Window.Resources>
Define a DataGridTempateDataColumn To Host The Bar
At this point, we have a converter and a means to reference it in our page. Now we need a special column in our grid that will host a Rectangle representing the value as its width. Here’s the simplified DataGrid with our template column, plus another column for comparison:
<DataGrid AutoGenerateColumns="False" Name="grdCountsByTag" IsReadOnly="True" >
    <DataGrid.Columns>

        <!-- Normal column for comparison -->
        <DataGridTextColumn Header="Avg. Age In Hours"
	    Binding="{Binding AvgAgeInHours, StringFormat=N2}" />

        <!-- Template holds rectangle, with variable width,
         and a Textblock for the text -->
        <DataGridTemplateColumn Header="%Allowing Remote"
			CanUserSort="True" SortMemberPath="PctAllowingRemote">
            <DataGridTemplateColumn.CellTemplate>
                <DataTemplate>
                    <Border Width="104" Height="20" >
                        <!-- Grid allows us to put 2 controls -->
                        <Grid>
                 <!--Rectangle has its width bound to the
                 value we display, using the converter! -->
                            <Rectangle Height="18" HorizontalAlignment="Left"
					VerticalAlignment="Center" Fill="DarkBlue"
					Margin="2 0 2 0"
                                Width="{Binding PctAllowingRemote,
					Converter={StaticResource widthConverter}}" />
                         <!-- Display the text; note transparent background color for Textblock
                         Color is chosen to be visible with either light or dark background -->
                            <TextBlock Background="Transparent"
					Foreground="BurlyWood" HorizontalAlignment="Center"
					Text="{Binding PctAllowingRemote, StringFormat=P}" />
                        </Grid>
                    </Border>
                </DataTemplate>
            </DataGridTemplateColumn.CellTemplate>
        </DataGridTemplateColumn>
        <DataGridTextColumn Header="Avg. # Related Skills"
		Binding="{Binding AvgNumRelatedSkills, StringFormat=N2}" />
    </DataGrid.Columns>
</DataGrid>
The XAML above represents the simplified data grid with a normal column for comparison, and a template column which holds the bar. The template holds two controls, a Rectangle with variable width and a Textblock to display the text value. Important: note that both controls are bound to the same value, ‘PctAllowingRemote. The rectangle binds its width to the that value, using the converter we defined above, while the Textblock binds its text.
A couple key points:
- You can place any kind of control in a template column
- Normally you can only have a single direct child control; I used a layout grid (not a DataGrid) as the direct child and the grid will allow multiple child controls
- By giving the Textblock a transparent background, it will appear on top of the rectangle
- The text color is not super nice, but I have little choice because it must be visible with either a light or dark background
- Normal columns allow sorting by default; but note that I had to specifically allow sorting (CanUserSort=”true”) and specify the column to use (please refer to the XAML for details.)
Bind Your DataGrid to an IEnumerable
I bound my entire grid to a List<TagAndCount> in code. Hopefully you already grasp that TagAndCount is a class and each row in the grid represents an instance of that class. Obviously, the class has properties that correspond to the grid columns, such as ‘PctAllowingRemote’. Here’s the code to bind it:
List<TagAndCount> tagList);
//...Write code to build the list, then bind:
grdCountsByTag.ItemsSource = tagList;
Summary
WPF gives you a lot of flexibility on how to display data. You should make your data easy to understand using graphical techniques; that reduces training costs and improves comprehension of your data. Your users will thank you for making the data easier to use!
We displayed our data using a rectangle whose width is bound to the data we are displaying. The rectangle was bound using a reference to a converter class we wrote, which converted a percentage value into a different value between 0 and 100. The rectangle was displayed in DataGridTemplateColumn.
Get the Code
I already hosted this project on Codeplex. Occasionally I update that site and add features, such as my new bar-chart column. You can download the entire project or seem more of the code on line. The project is available here: http://visualizejobskills.codeplex.com/
Make Debugging Easier with my Complex Object Visualizer
Use Reflection to Display Complex Objects While Debugging!
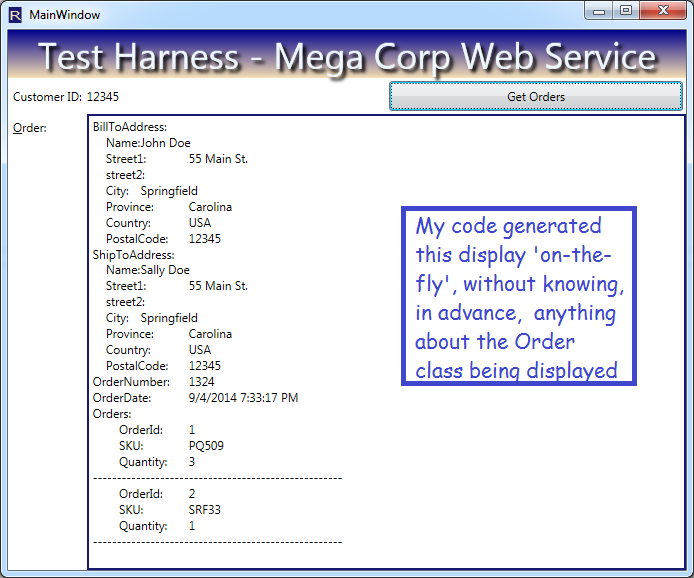
Problem: it is hard to inspect complicated objects in the debugger. Lately, I’ve been testing a lot of web services and using complex objects form 3rd party libraries. These objects are big, complicated chunks of data. If you’re like me, you might feel frustrated inspecting them in the debugger. Nested properties can be a pain, especially in huge lists. What I find particularly irritating is, having scrolled deep, deep down into a big nested object, is accidentally clicking away and loosing the whole freakin’ thing! It would be better if I could dump the entire object somewhere like the output window or an unused TextBox. And that’s just what I’ve done!

Reflection to the Rescue
if you’re familiar with the .NET Reflection API, you know that you can use it to examine or manipulate any programming object. I decided to use Reflection to display my complex objects by converting them to a nice, easy-to-read string.
Benefits
If you download my code, compile it into a dll, you can add it to any project. Next time you’re debugging, just use my method to blast your objects into a textbox or the output pane! You get instant visibility into complex, nested objects.
Nuts and Bolts: Reflection Methods that Make it Happen
I used these methods to generate a string representation of arbitrary objects:
- GetValue – retrieves the property value for your class instance, using a PropertyInfo object representing the property in question
- GetFields – I could have used it, but didn’t, because Web Services don’t return objects with fields. But! You can modify my code to do so, if desired.
-
- GetProperties – retrieves all properties for any class type. In the example above, it retrieved, for example, ‘ShipToAddress’, ‘Name’, ‘Street1’, Orders (an array) etc.
‘GetProperties’ returns an array of PropertyInfo objects; each PropertyInfo has
- PropertyType – for example, if the PropertyInfo represents my OrderID, then the PropertyType will be int
- Name – for example, ‘OrderId’
I also used the following property of the ‘Type’ class:
- IsArray – for an arbitrary type, tells you whether it is an array. I think it works for Lists as well, but I didn’t test, because, again, web services return arrays by default, and I’m testing Web Services right now.
Take a Look at the Short, Sweet Code!
// Returns a nice string representation of an arbitrary object, useful for debugging
public static string ComplexObjectToString(object someClassInstance, int indentLevel = 0) {
    StringBuilder sbResult = new StringBuilder();
    Type classType = someClassInstance.GetType();
    PropertyInfo[] allProperties = classType.GetProperties(BindingFlags.Public
                                    | BindingFlags.DeclaredOnly | BindingFlags.Instance);

    //If the current property is an array, loop through each entry and
    //display the member values, indented 4 characters deeper:
    if (someClassInstance is IEnumerable && !(someClassInstance is string)) {
        foreach (var anItem in (IEnumerable)someClassInstance) {
            if (IsNotCoreType(anItem.GetType()))
                sbResult.AppendFormat("{0}", anItem);
            else {
                string theItem = ComplexObjectToString(anItem, indentLevel + 4);
                sbResult.Append(theItem);
            }
            sbResult.AppendLine("---------------------");
        }
    } else {
        string indentSpaces = new string(' ', indentLevel);
        foreach (PropertyInfo pi in allProperties) {
            //Handle arrays and lists:
            if (IsEnumerable(pi.PropertyType)) {
                object subProperty = pi.GetValue(someClassInstance, null);
                sbResult.AppendLine(pi.Name + " items:");
                foreach (var anItem in (IEnumerable)subProperty) {
                    string subProps = ComplexObjectToString(anItem, indentLevel + 4);
                    sbResult.Append(subProps);
                    sbResult.AppendLine(new string(' ', indentLevel) + "------");
                }
            } else if (IsNotCoreType(pi.PropertyType)) {
                //Handle nested complex objects:
                object subProperty = pi.GetValue(someClassInstance, null);
                if (subProperty != null) {
                    sbResult.AppendFormat("{0}{1}:\n", indentSpaces, pi.Name);
                    string subProps = ComplexObjectToString(subProperty, indentLevel + 4);
                    sbResult.Append(subProps);
                }
            } else {
                if (!_UnwantedProperties.Contains(pi.Name)) {
                    //Handle normal properties, using the Name from the PropertyInfo and
                    //GetValue to retrieve each successive value
                    object propVal = pi.GetValue(someClassInstance, null);
                    sbResult.AppendFormat("{0}{1}:\t{2}\n", indentSpaces, pi.Name, propVal);
                }
            }
        }
    }
    return sbResult.ToString();
}

public static bool IsEnumerable(Type theType) {
    return theType.IsArray ||
                    (
                    theType != typeof(string)
                    &&
                    theType.GetInterfaces().Any(t => t == typeof(IEnumerable))
                    );
}

/// <summary>
/// Determines whether a given object is a 'built-in' class, such as int,
/// DateTime, string, etc.
/// </summary>
/// <param name="type">A type which might be a 'built-in' class</param>
/// <returns>True when the class needs to have its properties displayed</returns>
public static bool IsNotCoreType(Type type) {
    return !type.IsPrimitive && !type.ToString().StartsWith("System.");
    //return (type != typeof(object) && Type.GetTypeCode(type) == TypeCode.Object);
}

/// <summary>
/// These properties apply to every class, and I don't want to see them:
/// </summary>
private static string[] _UnwantedProperties = new string[] { "ExtensionData", "IsReadOnly",
                            "IsFixedSize", "IsSynchronized", "Length",
                            "LongLength", "Rank", "SyncRoot" };
}
Put it to Work and Visualize Your Data!
So, download my sample project. Extract the class ‘Utility’ and modify (it if you want). For example, you might want to see private properties or fields in your output (not there in this version); that would be easy for you to plug in. Now, build a class library; compile it to a dll. Add your dll to your project! Next debug session, use my class on your huge object back and spit-it-out into a textbox or the immediate pane of the debugger. Frustration relieved!

Future Directions
- If you’re feeling ambitious, you could adapt my technique to create your own fantastically useful Visual Studio Plug-in! http://msdn.microsoft.com/en-us/vstudio/vextend.aspx
- You could also consider using the Visual Studio T4 code generator in conjunction with the technique demonstrated here. For example, you could use it to generate label/textbox pairs, on-the-fly, for any class T4 Code generation:. http://msdn.microsoft.com/en-us/library/bb126445.aspx
- You could also incorporate it into your logging routines; that would allow you to capture the complete state of an object that might be misbehaving.
Update
I tweaked it some; I enhanced it to handle lists. I also added a universal XML serializer to the project, as part of the download.
Download
Code Link Download: Visualize Complex Objects. Note: recently revised to expose the functionality as a separate project, built as a dll.
Earn the Big Bucks By Learning New Job Skills Smartly
You’re smart, you love to code. You frequently learn new skills, because it’s fun and useful. But are you learning skills that employers want? Are you sure that, if your job loses stability, you can find a new one? Your favorite language may be cool – lots of skills are also cool – but wouldn’t you like to have job security as well as write cool code?
Or maybe you’re that guy who picked-up FoxPro years ago and hasn’t learned anything new since. Now your company wants to upgrade its technology; do you have alternatives? Or are you going to live in your car while you try to learn Android? All your peers learned new skills; maybe you should do the same now!

What You Can Learn Reading this Post
You can avoid sleeping in your car by intelligently analyzing the coding skills in demand now. After reading this article, you’ll be prepared to analyze the skills market and be smart about which new skills you learn!
So here are some things you can learn from this post:
- Make sure your skills are strong enough to look for a new job, or negotiate a better salary.
- Update your resume; use the right buzzwords to reflect your hard-earned knowledge. HR departments sometimes use bots to scan resumes – they don’t understand that, if you write code in C#, then you already know .NET!
- And what about learning a new, rare skill that pays high – can you pick that skill?
- You can use my free, easy to use, open source app to analyze what skills are in demand
I Doubled My Salary By Learning Skills in Demand
Quick story… Years ago, I was a mainframe programmer, and I could tell that my mainframe skills were rapidly becoming unmarketable. I was pretty underpaid to boot. My employers didn’t really treat me very well, and I didn’t have a lot of options with my current skill set. I took matters onto my own hands; having read “What Color is Your Parachute”, I took classes in VB, Java and C++. Then I begged to write my next work project in any of those new skills. They let me write my project in VB and tada! Now I had the skill and the experience. Shortly after finishing that project, I was able to switch jobs and double my salary, on the strength of my new skill!
Years later, I’m still doing fine, but I still want to list attractive skills on my resume, so I wrote a program to scrape data from the web and actually measure what the employers are looking for. Then I looked at the results and realized that I haven’t made the best choices about picking new technologies to learn. For fun, I thought I’d share what I learned with you. Maybe you can double your salary, or else avoid getting laid-off with no current skills.
Chances are you’re pretty smart… when it comes to maximizing your employer’s profit. But are you being smart on your own behalf? We programmers like to brag we are logic experts, capable of hard work. If you ever told someone you’re good at logic, and work like a slave, why don’t you prove it by logically analyzing your skills and working just a little to choose your new skills, for your own career!
I Wrote a Screen-Scraper/Analysis Program for Careers 2.0 (StackOverflow)
StackOverflow has a nice jobs board that displays only programming jobs. That made it easier to grab their data; it was also easier because they prominently display the major skills as searchable tags. I was able to get some real-world data and accurately dissect it!
My program grabs data from their site and analyze the approximately 700 jobs they have listed there. I posted my code on CodePlex at https://visualizejobskills.codeplex.com/releases/view/122002; you can download it free and run it yourself. The results could change your life.
When I first ran my program, the first thing I checked were the skills most in demand. Holy cow, Java Script is beating everyone these days! jQquery also surprised me with a #4 ranking, I had no idea they were so popular. I sure am glad I spent the time to learn those two! In fact, I know 6 of the top 10 skills pretty strongly; that’s the good news.

Some of my Skills Aren’t too Popular
But now for the bad news: lately I’ve been writing a lot of WPF with MVVM, using Test-Driven Development (TDD), and learning Rx (Rx == “Reactive Extensions”, a cool multi-threading API from Microsoft). If you download my Tag Analysis app from CodePlex, you’ll see exactly what I’m talking about. I searched for the rankings for these skills and was disappointed: WPF is #62, MVVM is #196; Rx is not even listed. At least TDD came in at #45.
You should do the same thing: get out your resume, look at your major skills, see how they rank with employers. Then check the skills you think are cool and might learn: do employers want them too?
Bottom line: I know some cool stuff, but not all of it is demanded right now. True, Stack Overflow is only a small sample (approx 700 jobs), but that does not disqualify it. I tend to think of Stack Overflow as the avaunt guard programmers. So while the data is not conclusive, but nonetheless highly indicative.
What Skills Should You Learn?
So, what should you be learning for new skills? Based on popularity and compatibility with my current skills, plus an idea of how hard they are to learn, I’d guess I personally should start looking at CSS3, node.js or AngularJs. The upside is that they are easy to learn and piggy-back on skills I already have. You should consider the same idea, i.e. build on what you know. Also, when picking a new skill, take a peak at what related skills employers seek.
But, maybe we should try to pick a rare skill that is hard to fill, in hopes of commanding a higher rate!
Identify Rare Skills that Pay Better
According to the law of Supply and Demand, rare skills command a higher rate than common skills. Based on the data available on Stack Overflow, I picked 3 measures of rareness:
- Posting Age. The longer the job has been listed, the more desperate the employer is to fill it. Some skills may, on average, be posted longer than others, implying scarcity.
- Percent remote work allowed per skill. Employers prefer to have you on site. But if they can’t find someone local, they’ll reluctantly relax their standards and hire remote workers. The more they need it, the more likely to allow remote, thus the more pressure to pay top dollar to whomever they can find.
- Average # other skills listed. Imagine the bosses having this conversation: “Hey Bob, this project will die if we don’t get an Erlang coder, we can’t find anyone. I don’t care if they don’t know TCP/IP or Linux, Rajiv can teach them
that. Just find me an Erlang guy! Write-up the ad without any other requirements than Erlang.” As it turned-out, there doesn’t seem to be much variation in the counts, so perhaps this measure is less powerful than I anticipated, it is definitely useful, but less than I wished.
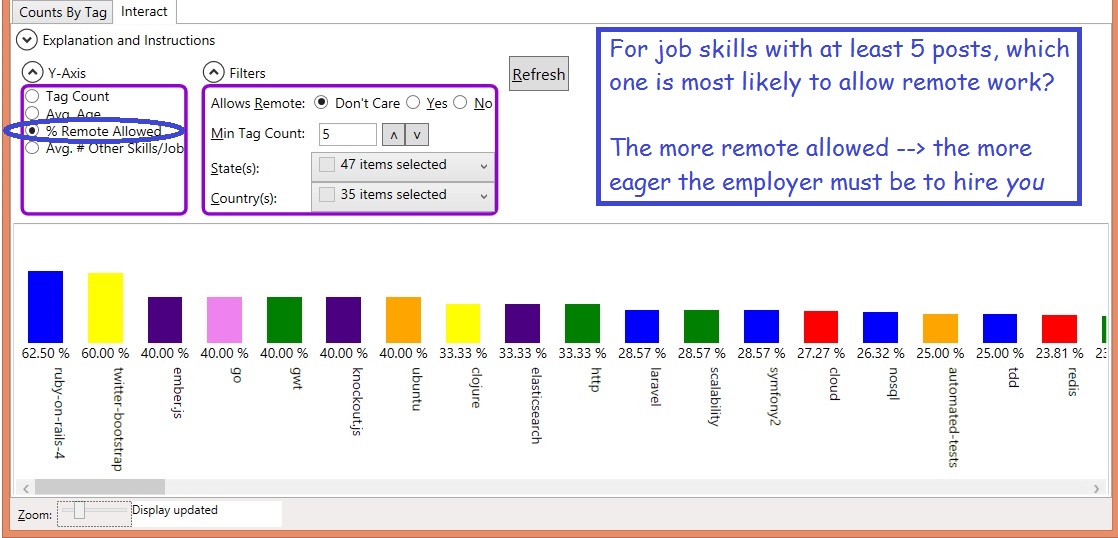
Looking at my screen shot, if I knew Ruby-On-Rails, I’d be feeling pretty good right now. It scores well for both % remote allowed and Avg. job age. The following other skills looked good to me, based on my measures of scarcity:
- GWT (presumably not the Global War on Terror, but Google Web Toolkit) – I already have some experience with the Google Maps API, and GWT scores well for % remote and average age.
- NoSql, Cassandra – I’m already pretty darn good at SQL, that means there should be less new material for me
- Amazon web services (probably not a good match for my skill set)
Are you Listing the Correct Buzzwords in Your Resume?
As I mentioned above, the HR departments (and their bots) don’t understand the skills their internal customers seek. For example, they don’t understand that, if you practice TDD, you also practice automated testing! Here are some tags I didn’t realize were in demand, but which I am adding to my own resume because I already know them:
- Performance analysis (I’ve worked with the .NET profiler)
- jQuery-UI
- Design patterns
- Automated testing, unit-testing, e-commerce, Web applications
- Model-View-Controller (Since I practice MVVM, I also practice MVC)
- OOP
- Active Directory – I thought it was too simple to list!
- http – I can’t believe this is a tag, but I’d hate to miss a job for lacking it
- Scripting – who writes these ads? It’s ranked #205
You should download my app and scrutinize the list of job tags. Make sure you list all common synonyms on your resume so HR won’t reject your resume before the IT folks see it.
What’s Your Plan for Success?
Don’t go randomly buying computer books based on hunches. Use your professional logic skills to strategically pick new skills to bolster your resume; see if you can learn something new that is not only cool, but also in demand. Why don’t you download my project and analyze the data yourself?
